As user-focused digital marketing kpi, metrics and analytics have become ubiquitous across the web landscape, context and experience are becoming key differentiators. Where not long ago, setting up and paying attention to even basic Google analytics meant your marketing efforts were keeping up, achieving table stakes today means developing a deeper understanding of your industry, your market, your competition and, most importantly, your users than ever before. At the highest level, this understanding begins with acknowledging the critical differences between business-to-consumer (B2C) and business-to-business (B2B) transactional behaviors and the key performance indicators (KPI) that best reflect progress, and ultimately success, in digital marketing strategy.
Ready for your custom KPI report?
Don't miss out on the opportunity to see how your site is performing. Fill out the information below, and let's get started.
Exploring differences between B2C and B2B
B2B and B2C digital marketing KPI are different because B2B and B2C users are different. The difference in size, complexity, and nature of the transaction means the motivations and drivers are completely different.
Where B2C purchasing is often based on simplicity, impulse or emotion and at a lower price and smaller scale, B2B buyers are more deliberate and focused on the solution and fit. B2B buyers are also pursuing a much larger purchase size and broader organizational impact.
Given these key differences, it makes sense that what digital marketing kpi to track is inherently very different as well.
In a B2C situation, overall site website traffic may be a good indicator of brand awareness and digital marketing success, and marketers would want to track key customer acquisition indicators such as shopping cart abandonment, average sales, and others to indicate progress and success. The B2B digital marketing campaign, however, needs to keep an eye on a different set of digital marketing KPI.
Essential digital marketing metrics and benchmarks for B2B websites
As an agency with more than 20 years of experience helping our B2B tech clients excel, we’ve not only learned what works from experience, but we’re able to draw broader conclusions on what’s happening in digital marketing based on what we’re seeing on our client sites.
Here are the essential digital marketing KPI we track for our B2B clients and why they’re important:
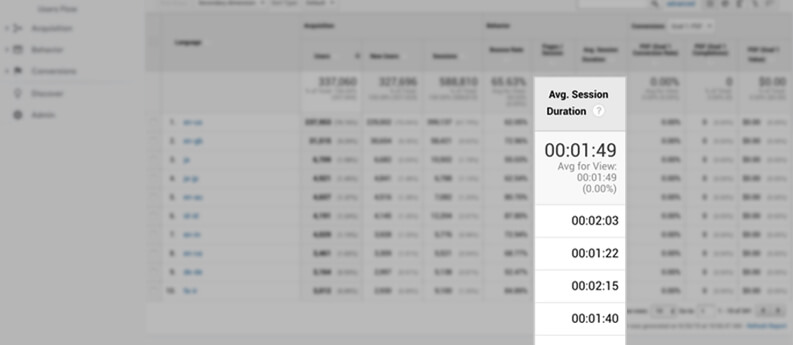
Average session duration: Monitoring user engagement
While B2C success is often based on a low cost, quick transaction, in the B2B landscape getting an indicator of how long marketers are able to keep users engaged with your content is critical. Average session duration is a key data point in analyzing the performance of B2B tech clients.
B2B sites with comparatively low session durations could be facing issues such as content marketing not aligning with user expectations, lack of engaging design, technical issues surrounding web site performance, or other inbound marketing issues. Conversely, sites with a higher session duration typically deliver a marketing strategy that provides users with a better, more intuitive path through the research and sales process that holds attention longer at each touchpoint, resulting in improved new customer acquisition.
Among our B2B clients with more than 20,000 users, we’re seeing average session durations around 0:02:03, with the median time of 00:01:44. The best of breed are finding average session durations as high as four or even six minutes, but there are campaign factors in their specific cases that drive some of these outliers on the high side. We see anything over two minutes as a strong performer in this space.
Pages per session: Creating a clear pathway
While in B2C it is less important and a low number may or may not reflect effective upstream marketing (ie., users arrive ready to buy), in B2B we pay special attention to pages per session in digital marketing strategy performance reviews.
A higher pages number, particularly combined with high duration, often reflects a campaign and/or broader marketing activity doing what we want it to be doing – helping each new customer learn about our clients and what they offer in a clear, intuitive way. In rare cases, an unusually high pages number may reflect usability issues around marketing channel expectations or arrangement, but more commonly it indicates a clear pathway and a good user experience.
Pages per session on the low side can be a warning sign that the right users aren’t coming in, that the next step isn’t clear enough, or that the design and/or content aren’t engaging enough to keep the website visitor interested in moving forward.
Among the marketing metrics of our B2B clients with more than 20,000 users, we’re seeing average pages per session close to 2.25, with median average pages per session of 2.05. Lead performers are seeing pages per session between 2.8 and 4.7, with anything over 2.5 showing a strong performance within our group.
With pages per session, as with all of our B2B digital marketing KPI, we’re careful to be sure that we’re working with partner marketers to weigh them in context of each other as well as the broader digital marketing strategy and competitive landscape, making sure each reading is considered appropriately as part of planning for next steps.
Sessions per user: Ensuring a smooth buying journey
While driving users toward fast, impulse transactions in B2C might mean fewer sessions per user – and much higher numbers of users to achieve the same revenue – in the B2B world, more sessions are usually necessary to complete the sales cycle and higher per website visitor numbers are expected. Monitoring this KPI can be an important flag that things are working or a signal that an issue needs to be addressed.
A per user session number that is too low could reflect problems in user experience and design, in product-market fit, in content marketing relevance, or in website technical performance. We usually see higher session per user numbers in websites that are recognizing effective B2B digital marketing results, where the visitor is finding what they need when they need it, and are advancing along the buyer journey.
Among the marketing metrics our larger B2B clients, we see an average of 1.45 sessions per user, with a median of 1.42. Our highest performers see numbers ranging from 1.5 to above 1.7.
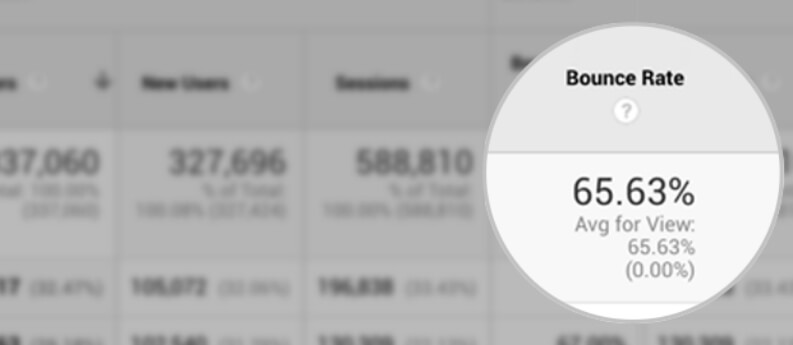
Bounce rate: Making sure your content fits
Bounce rate is a core B2B key performance indicator that is also often weighed highly in B2C as well, though in the latter case it’s weighed secondarily to sales volume and in a wholly different context. With B2B’s longer customer relationship and the complexity of information to be exchanged, a high bounce rate can be particularly troubling.
High bounce rates can be reflective of some kind of disconnect between visitor expectation and content delivered, such as an upstream marketing issue or other content problem. They can also mean the visitor found what they were looking for and left satisfied, but even in these cases an unusually high bounce rate can represent a missed customer acquisition opportunity: digital marketers to hold users’ attention with a better, more engaging next step.
Low bounce rates mean the user wanted at least a little bit more. This often means the page content and design are relevant and there was a match between the information provided and the point in the buying journey where the customer resides.
Among the marketing metrics of our B2B clients with more than 20,000 users, we’re seeing an average bounce rate of 60.55 percent, with a median slightly higher at 60.85 percent. Our strongest performers are in the 30 percent to 45 percent range, but we consider any bounce rate in the 55 percent range or lower a very good B2B bounce rate.
B2B lead generation KPI to keep in mind
When it comes to lead generation metrics for B2B websites, here are a couple of additional KPI to keep in mind:
Conversion paths: Validating your assumptions
Though it requires some deeper analysis, we make sure to review the marketing campaign conversion paths of our client sites as part of our standard B2B performance review. If we find conversion paths that are not consistent with the expected journeys based on customer personas, optimization of marketing strategy, user journeys and personas may be in order.
If there are significant differences between expectations and performance, a deeper research effort may be in order to understand the variance and any market changes. These kinds of discrepancies emerging in digital marketing efforts could mean that some initial assumptions are not aligning with actual results and need to be revisited.
Conversion rates: Nurturing sales relationships
In the relationship-focused, prolonged sales cycle that is at the center of B2B, getting that initial exploratory potential customer engaged is essential. Conversion rates are reflective of a budding sales relationship, and for that reason they’re considered a key performance indicator and ultimately essential for B2B business success.
Below average conversion rates can be caused by ineffective promotion or marketing of the form or gated asset, or could speak to the market interest in the product or service positioning, or timing. Low conversion rates could also be caused by a technical or performance problem, confusing content, or design/layout of the form itself.
Above average conversion rates often indicate the strength of product, content or service built on a foundation of simple, intuitive design and clear language.
Final thoughts
Today, more than ever, digital marketing metric planning, tracking and analysis are helping marketing team leaders transform their businesses. The team driving the most-successful results is the one who targets the right lead type, tracks the right things, and do so with a willingness to adjust marketing efforts along the way.
From web design, CMS websites, applications, ecommerce, motion graphics and multimedia, graphic design, and print, to Internet marketing solutions, we’ve got you covered.
Get our latest news, insights, and project spotlights delivered directly to your inbox.
* We are the sole owners of the information collected on this site. We only have access to/collect information that you voluntarily give us via email or other direct contact from you. We will not sell or rent this information to anyone.